
türkçe pop
Stokta yok
₺618,75
Stokta yok
₺644,53
₺773,44
₺539,06
türk sanat müziği

Stokta yok
₺391,41

₺351,56
Plak
₺464,06
Stokta yok
₺0,00
türk halk müziği
Plak
₺658,59
₺515,63
₺541,41
₺539,06
yabancı müzik
Stokta yok
Plak
₺464,06
Stokta yok
Plak
₺492,19
Plak
₺546,09

Stokta yok
₺0,00
özgün müzik
Stokta yok
Özgün Müzik
₺410,16
Stokta yok
Özgün Müzik
₺464,06
Özgün Müzik
₺541,41
Stokta yok
Özgün Müzik
₺679,69
arabesk
Arabesk
₺539,06
Arabesk
₺515,63
₺351,56
Arabesk
₺541,41
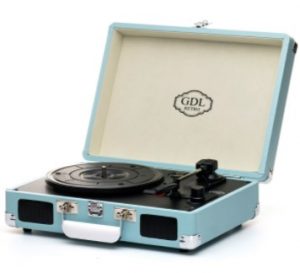
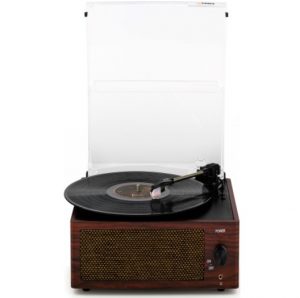
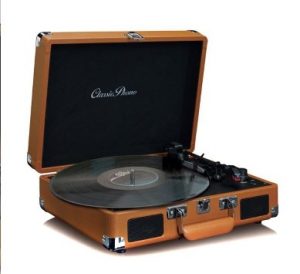
PİKAPLAR
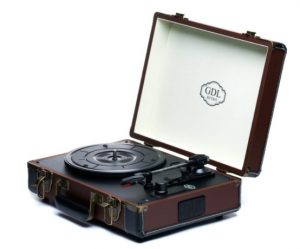
₺2.910,94
₺2.361,09
₺4.301,72
KEÇELER
Aksesuarlar
₺377,34
Aksesuarlar
₺377,34

Aksesuarlar
₺377,34

Aksesuarlar
₺377,34
aKSESUARLAR
Aksesuarlar
₺323,44
Aksesuarlar
₺323,44
Aksesuarlar
₺377,34
Aksesuarlar
₺377,34